Unreponsive due to high CPU usage

SLM

Member
After a WCS update to v.2.0.239-5.2.1914 we experienced that both our Flashphoner EC2 instances became unresponsive after a several hours. Streams were not handled anymore, publishers' sessions were interrupted and REST API access timed out.

This happened both on a m5.xlarge (4vCPU, 16GB) and a c5.xlarge (4vCPU, 8GB) instance after the upgrade and has never happened before. We've had issues regarding insanely large log files (see previous topic) and thus running out of disk space but that was fixed by setting ice_tcp_transport = true.

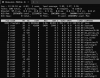
CPU on both instances was running at close to 400% (4 x 100%) at a certain point and presumably not because of high traffic / usage. Normally the m5 instance does not exceed 30% (out of 100%) CPU but after the upgrade suddenly increases out of nowhere to 100% in just a few minutes.

We've found that changing the default heap setting fixed this (no issues since changing it). It is strange however that this is suddenly an issue while it has not been an issue for 4 years since we've first started using Flashphoner (even with the 4GB c5.xlarge instance).

Default setting in wcs-core.properties:
-Xmx1024M

Changed to:
-Xmx8g -Xms8g

Which is half the memory of the m5 instance.

So far no high cpu issues occurred but apparently something in WCS's behaviour has changed that made this an issue. Also it's strange that this heap setting is not automatically set right at default when installing from the Flashphoner template on Amazon. Anyway, we hope that the increase in heap was indeed the fix to this problem.
 

Attachments

Max

Administrator
Staff member
Good day.
The default Java heap settings is for testing purposes only, they are not supposed to be used under high load. Perhaps you change it when moving the server to production.
Also it's strange that this heap setting is not automatically set right at default when installing from the Flashphoner template on Amazon
We can't set it automatically because use cases are different. Someone can deploy an additional software on the same instance, in this case instance RAM should be divided proportionally between WCS and other service.
 

SLM

Member
Unfortunately the problem happened again. It took longer this time to get to the point of unresponisveness and the server wasn't totally unresponsive but the CPU fluctuated rapidly but constantly from 1 to 100% and this did not stop even when all sessions and streams were diverted to another server. With just 1 SSH connection running top command it kept on using 1-100% of CPU. Memory usage was 66% constantly at that point. This state was going on for at least 30 minutes until I stopped WCS using webcallserver stop. It seems that once WCS goes beyond 70% CPU it's a point of no return since the last WCS update.
 

Max

Administrator
Staff member
Hello

1. Make sure jstack utility is reachable and works:

Code:
jstack PID > PID.txt
Here PID - is a pid of WCS process

2. Make sure jmap utility is reachable

Code:
jmap
3. If you encounter the issue again, please do the report

Code:
sudo /usr/local/FlashphonerWebCallServer/tools/report.sh --sysinfo --conf --dump --jstack --tar
Here

--jstack should add jstack output into the report.
Make sure jstack output is not empty.

--dump should execute command like jmap -dump:file=/tmp/46726.hprof 46726 where 46726 is PID of WCS process
Then output will be added to the report too. Make sure hprof file is not empty inside of the report.

You can also launch report for test purpose. In such a case please note, that jmap is a heavy operation which dumps all the memory of application and can affect streams during execution.

Please send us full report containing jstack and jmap output or download link (because jmap output will be few GB).
 

SLM

Member
Hello

1. Make sure jstack utility is reachable and works:

Code:
jstack PID > PID.txt
Here PID - is a pid of WCS process

2. Make sure jmap utility is reachable

Code:
jmap
...
Jmap is reachable but the Jstack command is not found.

Current java version:
openjdk version "14.0.1" 2020-04-14
OpenJDK Runtime Environment (build 14.0.1+7)
OpenJDK 64-Bit Server VM (build 14.0.1+7, mixed mode, sharing)

-------------------------
EDIT (2):/

Sorry, jstack command was not in path list, so this is the result:

/usr/java/jdk-14.0.1/bin/jstack PID > PID.txt

Result seems okay. I can't find a warning or error in the PID.txt
 
Last edited:

SLM

Member
Did you configure ZGC in wcs-core.properties?

# ZGC
-XX:+UnlockExperimentalVMOptions -XX:+UseZGC -Xms8g -Xmx8g

See more:

No, currently the following (default/unchanged) is in wcs core:

-XX:ErrorFile=/usr/local/FlashphonerWebCallServer/logs/error%p.log

-Xlog:gc*:/usr/local/FlashphonerWebCallServer/logs/gc-core-:time
# Use System.gc() concurrently in CMS
-XX:+ExplicitGCInvokesConcurrent
# Disable System.gc() for RMI, for 10000 hours
-Dsun.rmi.dgc.client.gcInterval=36000000000
-Dsun.rmi.dgc.server.gcInterval=36000000000

Should I replace all this with :
# ZGC
-XX:+UnlockExperimentalVMOptions -XX:+UseZGC -Xms8g -Xmx8g
 

Max

Administrator
Staff member
Example
Code:
/usr/java/jdk-14.0.1/bin/jstack 10663 > 10663.txt
Here 10663 is example of server process id `pidof java`
 

SLM

Member
Example
Code:
/usr/java/jdk-14.0.1/bin/jstack 10663 > 10663.txt
Here 10663 is example of server process id `pidof java`
Yes, I figured that out after I posted the edit.

Complete result is too big to post in here. I see mostly RUNNABLE and TIMED_WAITING
 

SLM

Member
I've sent the report. The ZGC was not yet configured on this server. Traffic is now on another server with that configuration.
 

SLM

Member
I've sent a second report. This time from the other server (with ZGC setting) on version v.2.0.240-5.2.1920 which saw the same issue after just 5 hours.

CPU spiked to 100% and then Flashphoner refused all streaming connections even when CPU went back to 0.


Schermafbeelding 2024-02-24 162224.png
 

Max

Administrator
Staff member
We raised the ticket WCS-4061 to perform load test and try to reproduce the issue.
 

SLM

Member
Thank you Max. I've updated the server yesterday and it's running for 24 hours now.

However, I'm seeing a few strange values in the WCS stats:

Code:
core_java_totalPhysicalMemorySize =  16318554112
core_java_committedMemory         = 426256351232
core_heap_memory_used             =    526385152
core_java_freePhysicalMemorySize  =   4113481728
core_java_uptime=84383234

Why is committedMemory so high? If this is in bytes then it's way too big considering the server only has 16 GB mem and 70 GB disk. I've seen these high values in previous versions too.

Next, in the errors section I see a lot of socketexceptions:
Code:
-----Errors info-----
java.net.SocketException=53910
java.nio.channels.ClosedChannelException=7
javax.net.ssl.SSLHandshakeException=3
com.flashphoner.media.rtp.D.E.A.E=30
java.lang.ArrayIndexOutOfBoundsException=1
java.lang.IllegalArgumentException=4
java.lang.NullPointerException=5
java.lang.reflect.InvocationTargetException=3
In the flashphoner logs I see entries like these:
01:00:00,691 WARN StunUdpSocket - STUN-UDP-pool-40-thread-239 [id: 0x24b68906, /172.xx.xx.xxx:31830] Failed to send or receive message
java.net.SocketException: Message too long
 

Max

Administrator
Staff member
Why is committedMemory so high? If this is in bytes then it's way too big considering the server only has 16 GB mem and 70 GB disk. I've seen these high values in previous versions too.
Commited memory is a virtual memory, so it may be greater than a physical one.
java.net.SocketException: Message too long
You can tune UDP socket buffers at system level: UDP socket buffers tuning on system level
Code:
sudo sysctl -w net.core.rmem_max=26214400
sudo sysctl -w net.core.rmem_default=26214400
Or switch to TCP transport
Code:
ice_tcp_transport=true
 

SLM

Member
Can I do this UDP socket buffer tuning while WCS is running and handling streams? Or do I need to stop the service first? Will it retain these values at server reboot ?

Are there any downsides of this setting:
ice_tcp_transport=true
 
Top