Prometheus SIP metrics details

mbedial

Member
Hi,
we are integrating our WCS with Prometheus.
I've been searching for the detail of the metrics , I mean, if the values are gauges, counters, etc, but I didn't found toomuch info.

Most of all we are interested in SIP calls monitoring , and I see these values:


-----Call Stats-----
sip_processed_calls=5
sip_calls_state=established/0;trying/0;ringing/0;ring/0;ring_media/0;hold/0;busy/0;finish/0;session_progress/0;pending/0;failed/0
sip_calls=0
sip_calls_established=0
sip_calls_in=0
sip_calls_out=0
sip_calls_per_second=0.00
-----Sip Stats-----
sip_registered=15


Where can we find detalied info about the type and meaning of the metrics?

Thanks in advance
 

Max

Administrator
Staff member
Good day.
All the SIP metrics are described in this table (see call_stats and sip_stats sections):
sip_callsNumber of SIP calls
sip_calls_establishedNumber of active SIP calls
sip_calls_inNumber of incoming SIP calls
sip_calls_outNumber of outgoing SIP calls
sip_calls_per_second (cps)Number of SIP calls per second
sip_registeredNumber of clients in the REGISTERED state
sip_calls_state displays how many calls in certain state on server at the moment.
 

mbedial

Member
Hi again max.
We have integrated it, but we've found a problem. To be exact, prometheus waits float metrics with point, but no with comma. We can see some correct metrics but other no, like theses:

network_stats{param="global_bandwidth_in"} 0,000
network_stats{param="global_bandwidth_out"} 0,000


See the attached file with the failed parser.
 

Attachments

Max

Administrator
Staff member
We have integrated it, but we've found a problem. To be exact, prometheus waits float metrics with point, but no with comma. We can see some correct metrics but other no, like theses:

network_stats{param="global_bandwidth_in"} 0,000
network_stats{param="global_bandwidth_out"} 0,000
This seems to be system locale issue. Please check if system locale is set to en_US:
Code:
LANG=en_US.UTF-8
LC_CTYPE="en_US.UTF-8"
LC_NUMERIC="en_US.UTF-8"
LC_TIME="en_US.UTF-8"
LC_COLLATE="en_US.UTF-8"
LC_MONETARY="en_US.UTF-8"
LC_MESSAGES="en_US.UTF-8"
LC_PAPER="en_US.UTF-8"
LC_NAME="en_US.UTF-8"
LC_ADDRESS="en_US.UTF-8"
LC_TELEPHONE="en_US.UTF-8"
LC_MEASUREMENT="en_US.UTF-8"
LC_IDENTIFICATION="en_US.UTF-8"
LC_ALL=
 

mbedial

Member
Actually the locale is:

locale
LANG=es_ES.UTF-8
LANGUAGE=
LC_CTYPE="es_ES.UTF-8"
LC_NUMERIC="es_ES.UTF-8"
LC_TIME="es_ES.UTF-8"
LC_COLLATE="es_ES.UTF-8"
LC_MONETARY="es_ES.UTF-8"
LC_MESSAGES="es_ES.UTF-8"
LC_PAPER="es_ES.UTF-8"
LC_NAME="es_ES.UTF-8"
LC_ADDRESS="es_ES.UTF-8"
LC_TELEPHONE="es_ES.UTF-8"
LC_MEASUREMENT="es_ES.UTF-8"
LC_IDENTIFICATION="es_ES.UTF-8"
LC_ALL=


Is mandatory to have en_US ?
 

mbedial

Member
Hi again.
we finally set locale to en_US, but it's really strange, since we have 2 servers, and after setting it , it just works in one server:

Server 1 (working fine)

locale
LANG=en_US.UTF-8
LANGUAGE=
LC_CTYPE="en_US.UTF-8"
LC_NUMERIC="en_US.UTF-8"
LC_TIME="en_US.UTF-8"
LC_COLLATE="en_US.UTF-8"
LC_MONETARY="en_US.UTF-8"
LC_MESSAGES="en_US.UTF-8"
LC_PAPER="en_US.UTF-8"
LC_NAME="en_US.UTF-8"
LC_ADDRESS="en_US.UTF-8"
LC_TELEPHONE="en_US.UTF-8"
LC_MEASUREMENT="en_US.UTF-8"
LC_IDENTIFICATION="en_US.UTF-8"
LC_ALL=

In this server executing this comman we see the correct values:
curl http://localhost:8081/?action=stat&format=prometheus


-----System Stats-----
system_java_cpu_usage=5.88
system_java_load_average=1.30
-----Network Stats (Mbit/s)-----
global_bandwidth_in=0.000
global_bandwidth_out=0.000


Server 2: Not working:

In this case we don't see the correct valuies even when the locale is the same:

-----System Stats-----
system_java_cpu_usage=13.33
system_java_load_average=0.52
-----Network Stats (Mbit/s)-----
global_bandwidth_in=0,000
global_bandwidth_out=0,000

locale
LANG=en_US.UTF-8
LANGUAGE=
LC_CTYPE="en_US.UTF-8"
LC_NUMERIC="en_US.UTF-8"
LC_TIME="en_US.UTF-8"
LC_COLLATE="en_US.UTF-8"
LC_MONETARY="en_US.UTF-8"
LC_MESSAGES="en_US.UTF-8"
LC_PAPER="en_US.UTF-8"
LC_NAME="en_US.UTF-8"
LC_ADDRESS="en_US.UTF-8"
LC_TELEPHONE="en_US.UTF-8"
LC_MEASUREMENT="en_US.UTF-8"
LC_IDENTIFICATION="en_US.UTF-8"
LC_ALL=

Any idea?

Thanks in advance.
Mario
 

Max

Administrator
Staff member
Please check if WCS build, configuration and JDK are the same on both servers. If not, make the problem server setup identical to a good one. If this does not help, collect a report from the problem server as decsribed here using report.sh script, and send using this form.
 

mbedial

Member
More info. If we check the enviroment for the process we see the /LANG=es even when locale is en_US ¿?¿?

/proc/255364# cat environ
MALLOC_ARENA_MAX=4PWD=/LANG=es_ES.UTF-8INVOCATION_ID=bdbfcfc780a84196977580f01e9dac34WCS_APP_HOME=/usr/local/FlashphonerWebCallServerSHLVL=0LD_LIBRARY_PATH=/usr/local/FlashphonerWebCallServer/lib/soWCS_APP_ABSOLUTE_HOME=/usr/local/FlashphonerWebCallServer-5.2.597-135522542310a0e0fc13fb0ba07ebb8af3a95d8f_EXECJAVA=javaJOURNAL_STREAM=9:884442447PATH=/usr/local/sbin:/usr/local/bin:/usr/sbin:/usr/bin:/sbin:/binWCS_STARTUP_LOG=/usr/local/FlashphonerWebCallServer/logs/startup.logWCS_JAVA_OPTS=-Xmx1024M -XX:+UseConcMarkSweepGC -XX:+UseCMSInitiatingOccupancyOnly -XX:CMSInitiatingOccupancyFraction=70 -Djava.net.preferIPv4Stack=true -Dcom.sun.management.jmxremote=true -Dcom.sun.management.jmxremote.local.only=false -Dcom.sun.management.jmxremote.ssl=false -Dcom.sun.management.jmxremote.authenticate=false -Dcom.sun.management.jmxremote.port=50999 -Dcom.sun.management.jmxremote.host=localhost -Djava.rmi.server.hostname=localhost -XX:ErrorFile=/usr/local/FlashphonerWebCallServer/logs/error%p.log -XX:+PrintGCDateStamps -XX:+PrintGCDetails -Xloggc:/usr/local/FlashphonerWebCallServer/logs/gc-core-2022-01-19_07-50.log -XX:+ExplicitGCInvokesConcurrent -Dsun.rmi.dgc.client.gcInterval=36000000000 -Dsun.rmi.dgc.server.gcInterval=36000000000_=/usr/bin/javaroot@AST4:/proc/255364#

and in the other server that works:

more /proc/3913908/environ
SHELL=/bin/shH=/usr/local/FlashphonerWebCallServer/lib/sod8fpGC -XX:+UseCMSInitiatingOccupancyOnly -XX:CMSInitiatingOccupancyFraction=70 -Djava.net.preferIPv4Stack=true -Dcom.sun.management.jmxremote=true -D
com.sun.management.jmxremote.local.only=false -Dcom.sun.management.jmxremote.ssl=false -Dcom.sun.management.jmxremote.authenticate=false -Dcom.sun.
management.jmxremote.port=50999 -Dcom.sun.management.jmxremote.host=localhost -Djava.rmi.server.hostname=localhost -XX:ErrorFile=/usr/local/Flashph
onerWebCallServer/logs/error%p.log -XX:+PrintGCDateStamps -XX:+PrintGCDetails -Xloggc:/usr/local/FlashphonerWebCallServer/logs/gc-core-2022-01-19_0
7-24.log -XX:+ExplicitGCInvokesConcurrent -Dsun.rmi.dgc.client.gcInterval=36000000000 -Dsun.rmi.dgc.server.gcInterval=36000000000
 
Last edited:

Max

Administrator
Staff member
More info. If we check the enviroment for the process we see the /LANG=es even when locale is en_US ¿?¿?
Please check /usr/local/FlashphonerWebCallServer/bin/setenv.sh file. Seems like LANG is set explicilty in the file. If not, please provide SSH access to the server using this form
 

mbedial

Member
Although both servers had the same setenv.sh, we have added LANG=en_US.UTF-8 in this file anf finally works. Thanks a lot for your support.
 

mbedial

Member
Hi again, before closing this thread, I'd like to ask about the metrics again, since I don't know if the attached jpeg makes sense.
We have 2 twins server with exactly the same config, however as you can see in the graphic, it seems that in one the sip_stats is a counter and in the other a gauge. Is this correct?
Thanks again.
 

Attachments

Max

Administrator
Staff member
sip_registered parameter is a current number of SIP sessions registered since WCS starts. So please check if second server is not restarting every 5 minutes. If not please provide SSH access and SIP credentials (two accounts) to make a test call using this form.
 

mbedial

Member
Hi Max,
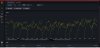
you are right, the server is restarting every 5 minutes, but we don't know why...
Some logs here:

09:40:02,575 ERROR RestClient - API-ASYNC-pool-12-thread-2 Got exception in REST
java.net.SocketException: Connection reset
at java.net.SocketInputStream.read(SocketInputStream.java:210)
at java.net.SocketInputStream.read(SocketInputStream.java:141)
at org.apache.http.impl.io.SessionInputBufferImpl.streamRead(SessionInputBufferImpl.java:136)
at org.apache.http.impl.io.SessionInputBufferImpl.fillBuffer(SessionInputBufferImpl.java:152)
at org.apache.http.impl.io.SessionInputBufferImpl.readLine(SessionInputBufferImpl.java:270)
at org.apache.http.impl.conn.DefaultHttpResponseParser.parseHead(DefaultHttpResponseParser.java:140)
at org.apache.http.impl.conn.DefaultHttpResponseParser.parseHead(DefaultHttpResponseParser.java:57)
at org.apache.http.impl.io.AbstractMessageParser.parse(AbstractMessageParser.java:260)
at org.apache.http.impl.DefaultBHttpClientConnection.receiveResponseHeader(DefaultBHttpClientConnection.java:161)
at org.apache.http.impl.conn.CPoolProxy.receiveResponseHeader(CPoolProxy.java:153)
at org.apache.http.protocol.HttpRequestExecutor.doReceiveResponse(HttpRequestExecutor.java:271)
at org.apache.http.protocol.HttpRequestExecutor.execute(HttpRequestExecutor.java:123)
at org.apache.http.impl.execchain.MainClientExec.execute(MainClientExec.java:254)
at org.apache.http.impl.execchain.ProtocolExec.execute(ProtocolExec.java:195)
at org.apache.http.impl.execchain.RetryExec.execute(RetryExec.java:86)
at org.apache.http.impl.execchain.RedirectExec.execute(RedirectExec.java:108)
at org.apache.http.impl.client.InternalHttpClient.doExecute(InternalHttpClient.java:184)
at org.apache.http.impl.client.CloseableHttpClient.execute(CloseableHttpClient.java:82)
at org.apache.http.impl.client.CloseableHttpClient.execute(CloseableHttpClient.java:106)
at com.flashphoner.rest.client.RestClient.postForObject(Unknown Source)
at com.flashphoner.server.rmi.ManagerApiConnection.processDataObject(Unknown Source)
at com.flashphoner.server.rmi.ManagerApiConnection.getApiMethodResult(Unknown Source)
at com.flashphoner.server.rmi.ManagerApiConnection.lambda$notifyApiAsync$1(Unknown Source)
at java.util.concurrent.CompletableFuture$AsyncRun.run(CompletableFuture.java:1626)
at java.util.concurrent.ThreadPoolExecutor.runWorker(ThreadPoolExecutor.java:1142)
at java.util.concurrent.ThreadPoolExecutor$Worker.run(ThreadPoolExecutor.java:617)
at java.lang.Thread.run(Thread.java:745)
09:47
09:40:02,576 WARN ManagerApiConnection - API-ASYNC-pool-12-thread-2 Failed to get object from REST with exception:Connection reset

And a new restart but with other log:

ava HotSpot(TM) 64-Bit Server VM (25.121-b13) for linux-amd64 JRE (1.8.0_121-b13), built on Dec 12 2016 16:36:53 by "java_re" with gcc 4.3.0 20080428 (Red Hat 4.3.0-8)
Memory: 4k page, physical 32839692k(6261072k free), swap 16744444k(16744444k free)
CommandLine flags: -XX:CMSInitiatingOccupancyFraction=70 -XX:ErrorFile=/usr/local/FlashphonerWebCallServer/logs/error%p.log -XX:+ExplicitGCInvokesConcurrent -XX:InitialHeapSize=525435072 -XX:+ManagementServer -XX:MaxHeapSize=1073741824 -XX:MaxNewSize=348966912 -XX:MaxTenuringThreshold=6 -XX:OldPLABSize=16 -XX:+PrintGC -XX:+PrintGCDateStamps -XX:+PrintGCDetails -XX:+PrintGCTimeStamps -XX:+UseCMSInitiatingOccupancyOnly -XX:+UseCompressedClassPointers -XX:+UseCompressedOops -XX:+UseConcMarkSweepGC -XX:+UseParNewGC
2022-01-24T09:48:25.222+0100: 1.390: [GC (Allocation Failure) 2022-01-24T09:48:25.222+0100: 1.391: [ParNew: 137152K->17088K(154240K), 0.0423904 secs] 137152K->31772K(496960K), 0.0425188 secs] [Times: user=0.06 sys=0.01, real=0.04 secs]
2022-01-24T09:48:26.431+0100: 2.600: [GC (Allocation Failure) 2022-01-24T09:48:26.431+0100: 2.600: [ParNew: 154240K->17088K(154240K), 0.1062631 secs] 168924K->46638K(496960K), 0.1063809 secs] [Times: user=0.16 sys=0.02, real=0.10 secs]
2022-01-24T09:48:26.540+0100: 2.709: [GC (CMS Initial Mark) [1 CMS-initial-mark: 29550K(342720K)] 48949K(496960K), 0.0073669 secs] [Times: user=0.02 sys=0.00, real=0.01 secs]
2022-01-24T09:48:26.548+0100: 2.716: [CMS-concurrent-mark-start]
2022-01-24T09:48:26.567+0100: 2.735: [CMS-concurrent-mark: 0.019/0.019 secs] [Times: user=0.07 sys=0.00, real=0.02 secs]
2022-01-24T09:48:26.567+0100: 2.735: [CMS-concurrent-preclean-start]
2022-01-24T09:48:26.568+0100: 2.736: [CMS-concurrent-preclean: 0.001/0.001 secs] [Times: user=0.00 sys=0.00, real=0.00 secs]
2022-01-24T09:48:26.568+0100: 2.736: [CMS-concurrent-abortable-preclean-start]
2022-01-24T09:48:27.051+0100: 3.220: [CMS-concurrent-abortable-preclean: 0.318/0.483 secs] [Times: user=1.15 sys=0.03, real=0.48 secs]
2022-01-24T09:48:27.053+0100: 3.222: [GC (CMS Final Remark) [YG occupancy: 99846 K (154240 K)]2022-01-24T09:48:27.053+0100: 3.222: [Rescan (parallel) , 0.0120013 secs]2022-01-24T09:48:27.065+0100: 3.234: [weak refs processing, 0.0000303 secs]2022-01-24T09:48:27.065+0100: 3.234: [class unloading, 0.0039757 secs]2022-01-24T09:48:27.069+0100: 3.238: [scrub symbol table, 0.0029108 secs]2022-01-24T09:48:27.072+0100: 3.241: [scrub string table, 0.0008249 secs][1 CMS-remark: 29550K(342720K)] 129397K(496960K), 0.0206552 secs] [Times: user=0.05 sys=0.00, real=0.02 secs]
2022-01-24T09:48:27.075+0100: 3.243: [CMS-concurrent-sweep-start]
2022-01-24T09:48:27.083+0100: 3.251: [CMS-concurrent-sweep: 0.008/0.008 secs] [Times: user=0.01 sys=0.00, real=0.01 secs]
2022-01-24T09:48:27.083+0100: 3.252: [CMS-concurrent-reset-start]
2022-01-24T09:48:27.090+0100: 3.259: [CMS-concurrent-reset: 0.007/0.007 secs] [Times: user=0.00 sys=0.01, real=0.01 secs]
2022-01-24T09:48:43.949+0100: 20.118: [GC (Allocation Failure) 2022-01-24T09:48:43.949+0100: 20.118: [ParNew: 154240K->17087K(154240K), 0.0335835 secs] 166311K->52744K(496960K), 0.0337222 secs] [Times: user=0.08 sys=0.01, real=0.03 secs]
2022-01-24T09:50:54.194+0100: 150.362: [GC (Allocation Failure) 2022-01-24T09:50:54.194+0100: 150.362: [ParNew: 154239K->5668K(154240K), 0.0154916 secs] 189896K->45143K(496960K), 0.0156999 secs] [Times: user=0.04 sys=0.00, real=0.02 secs]
2022-01-24T09:52:52.393+0100: 268.561: [GC (Allocation Failure) 2022-01-24T09:52:52.393+0100: 268.561: [ParNew: 142820K->3217K(154240K), 0.0067521 secs] 182295K->42691K(496960K), 0.0069349 secs] [Times: user=0.02 sys=0.00, real=0.01 secs]

M
 

Max

Administrator
Staff member
We checked your server. According to startup.log file, seems like server is restarting manually or by some periodic script:
Code:
java version "1.8.0_121"
Java(TM) SE Runtime Environment (build 1.8.0_121-b13)
Java HotSpot(TM) 64-Bit Server VM (build 25.121-b13, mixed mode)
[2022-01-25 07:08:23] Starting Flashphoner Web Call Server
[2022-01-25 07:16:01] Flashphoner Web Call Server stopped
In main server log there are only wrong options warnings (and we recommend to remove those options from flashphoner.properties file)
Code:
07:16:24,406 WARN              Settings - main Setting 'enable_context_logs' is not found. Please check setting.
07:16:24,407 WARN              Settings - main Setting 'log_level' is not found. Please check setting.
07:16:26,405 WARN                     A - main Can't read custom watermark file
Unfortunately, we canot neither switsh server logs to INFO level nor look at /var/log/syslog file because the SSH credentials you've provided does not allow sudo.
So please check syslog file for webcallserver service termination by SIGABRT. If not, please switch server logs to INFO level in log4j.properties file:
Code:
log4j.rootLogger=info, stdout, fAppender
Then, check server log. If it looks like normal starting/stopping log, please check crontab and other periodical services for commands like
Code:
webcallserver start
webcallserver stop
webcallserver restart
 

mbedial

Member
Thanks a lot.
We have found an event that could cause those restart and we have removed. It's been solved.
Mario
 
Top